
Page 11 - index
P. 11
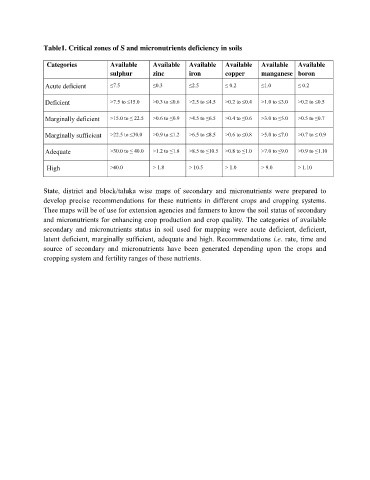
Table1. Critical zones of S and micronutrients deficiency in soils

                Categories           Available      Available   Available   Available   Available   Available
                                     sulphur        zinc        iron        copper     manganese  boron

                Acute deficient      ≤7.5           ≤0.3        ≤2.5        ≤ 0.2      ≤1.0         ≤ 0.2

                Deficient            >7.5 to ≤15.0   >0.3 to ≤0.6   >2.5 to ≤4.5   >0.2 to ≤0.4   >1.0 to ≤3.0   >0.2 to ≤0.5


                Marginally deficient   >15.0 to ≤ 22.5   >0.6 to ≤0.9   >4.5 to ≤6.5   >0.4 to ≤0.6   >3.0 to ≤5.0   >0.5 to ≤0.7

                Marginally sufficient   >22.5 to ≤30.0   >0.9 to ≤1.2   >6.5 to ≤8.5   >0.6 to ≤0.8   >5.0 to ≤7.0   >0.7 to ≤ 0.9

                Adequate             >30.0 to ≤ 40.0   >1.2 to ≤1.8   >8.5 to ≤10.5   >0.8 to ≤1.0   >7.0 to ≤9.0   >0.9 to ≤1.10


                High                 >40.0          > 1.8       > 10.5      > 1.0      > 9.0        > 1.10

               State,  district  and  block/taluka  wise  maps  of  secondary  and  micronutrients  were  prepared  to
               develop  precise recommendations for these nutrients  in  different  crops and cropping systems.
               Thee maps will be of use for extension agencies and farmers to know the soil status of secondary
               and micronutrients for enhancing crop production and crop quality. The categories of available
               secondary  and  micronutrients  status  in  soil  used  for  mapping  were  acute  deficient,  deficient,
               latent deficient, marginally sufficient, adequate and high. Recommendations i.e. rate, time and
               source  of  secondary  and  micronutrients  have  been  generated  depending  upon  the  crops  and

               cropping system and fertility ranges of these nutrients.