Page 14 - index
P. 14

Sulphur                                           Zinc


                                    Iron                                        Manganese


                                  Copper                                           Boron
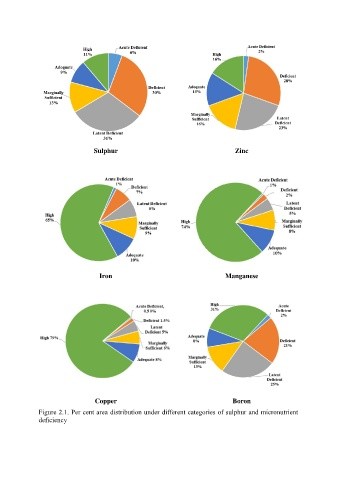
               Figure 2.1. Per cent area distribution under different categories of sulphur and micronutrient
               deficiency
   9   10   11   12   13   14   15   16   17   18   19